16 Feb Microfluidic analysis of enzymatically dissociated tissues
In the ever-evolving field of biomedical research, the ability to accurately sort and analyze cells is paramount. The recent advent of microfluidics has paved the way for groundbreaking advancements in this domain. A stellar example of this innovation is presented in a research article that delves into the intricacies of labelfree imaging flow cytometry for the analysis and sorting of enzymatically dissociated tissues.
The study introduces a microfluidic device known as sorting real-time deformability cytometry (soRTDC), a technique that harnesses the potential of microfluidics to perform label-free analysis and sorting of single cells. This microfluidic chip is ingeniously designed to analyze brightfield images of cells using a deep neural network (DNN), facilitating precise sorting decisions based on the physical properties of the cells.
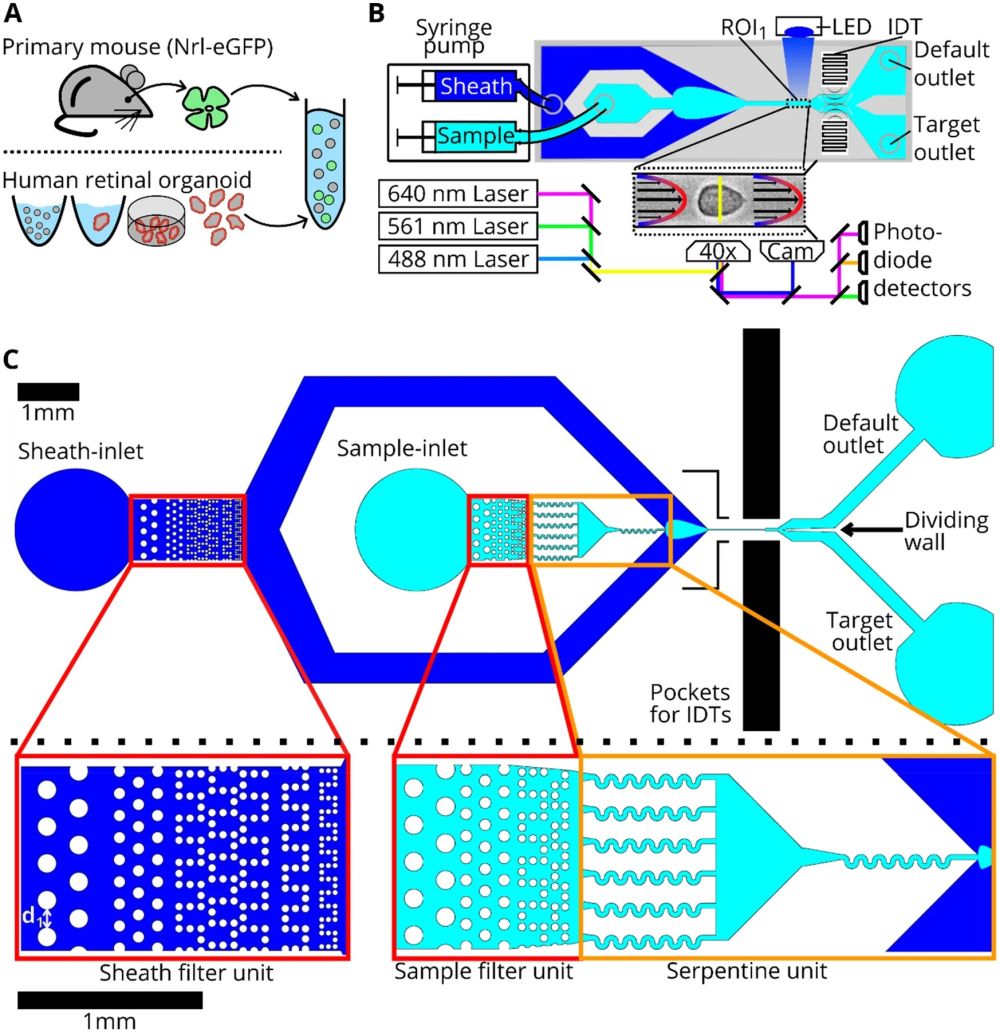
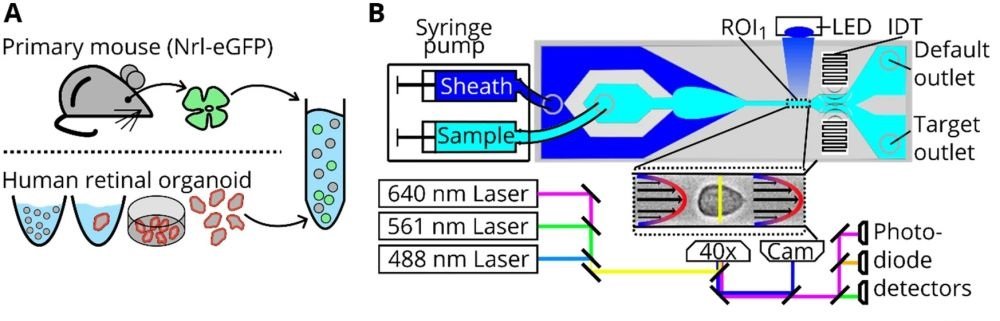
“Cell preparation, soRT-FDC setup and chip design. (A) Retinae from reporter mice (Nrl-eGFP) or human retinal organoids (Crx-mCherry) are dissociated and resuspended in measurement buffer for soRT-FDC. (B) Sketch of the soRT-FDC setup. Two syringe pumps supply a microfluidic chip with sample and sheath fluid. Lasers excite fluorescence signal which is measured by avalanche photodetectors and the cell is imaged by a high-speed camera. A high-power LED illuminates the cell. Interdigital transducers (IDTs) excite surface acoustic waves, which push selected cells towards the target outlet. (C) Figure shows the 2D-CAD design of the entire sorting chip and zoomed in versions show specific parts. The red rectangles indicate filter assemblies, which consist of a cascade of pillars with decreasing distance. The orange rectangles indicate a unit of several serpentines, which helps to divide aggregates of cells and to increase the spacing between cells. The layout was designed using KLayout 0.25.3.” Reproduced under Creative Commons Attribution 4.0 International License from Herbig, M., Tessmer, K., Nötzel, M. et al. Label-free imaging flow cytometry for analysis and sorting of enzymatically dissociated tissues. Sci Rep 12, 963 (2022).
Cell sorting from tissues is fraught with challenges, ranging from alterations in cell morphology to the presence of aggregates. The research meticulously addresses these issues, presenting robust software and hardware solutions to enhance the reliability of data analysis and cell sorting. The microfabrication of the mcirofluidic chip plays a crucial role, with an updated design that promotes the microfluidic-based division of cell aggregates, ensuring a higher purity in cell sorting. The chip features multiple columns of increasingly narrowly spaced filter pillars, which play a pivotal role in retaining or resolving interfering objects and separating cell aggregates. Additionally, serpentine channels are incorporated to increase the spacing between cells and aid in the division of cell aggregates.
The researchers conducted experiments using dissociated retina cells from human retinal organoids and mouse eyes. The cells were resuspended in a measurement buffer with elevated viscosity and subjected to the soRTDC microfluidic device for analysis and sorting. The device demonstrated a capability of capturing brightfield images and fluorescence information from single cells at a rate of 10 cells per second, with a sorting capability of 2 cells per second.
To address the issue of cell aggregates, the team introduced a convolutional neural network (CNN) for the detection of aggregates in images, allowing for the exclusion of such events during data analysis. This innovative approach ensures a more reliable and accurate sorting of single cells, even in the presence of cell aggregates.
The label-free identification of cells based on their inherent physical and morphological properties, as demonstrated in this study, stands as a promising alternative to traditional cell-typing methods. This approach not only preserves the natural state of the cells but also opens up new avenues in precision medicine, particularly in the enrichment of specific cell types for therapeutic applications.
The integration of microfluidics in cell sorting and analysis has marked a new era in biomedical research. The soRTDC microfluidic device exemplifies this progress, offering a labelfree, reliable, and precise method for sorting cells from dissociated tissues. As we continue to unravel the complexities of cellular behavior, microfluidic technology remains at the forefront, driving innovation and enhancing our capabilities in cell analysis.
Figures and the abstract are reproduced from Herbig, M., Tessmer, K., Nötzel, M. et al. Label-free imaging flow cytometry for analysis and sorting of enzymatically dissociated tissues. Sci Rep 12, 963 (2022).https://doi.org/10.1038/s41598-022-05007-2 under Creative Commons Attribution 4.0 International License
Read the original article: Label-free imaging flow cytometry for analysis and sorting of enzymatically dissociated tissues